Dashboard & Integration
Project Overview
We are building a Real-Time Energy Management Dashboard using Next.js. The dashboard acts as a "Digital Twin", visualizing high-frequency telemetry (Voltage, Power, State) streaming from our Edge devices.
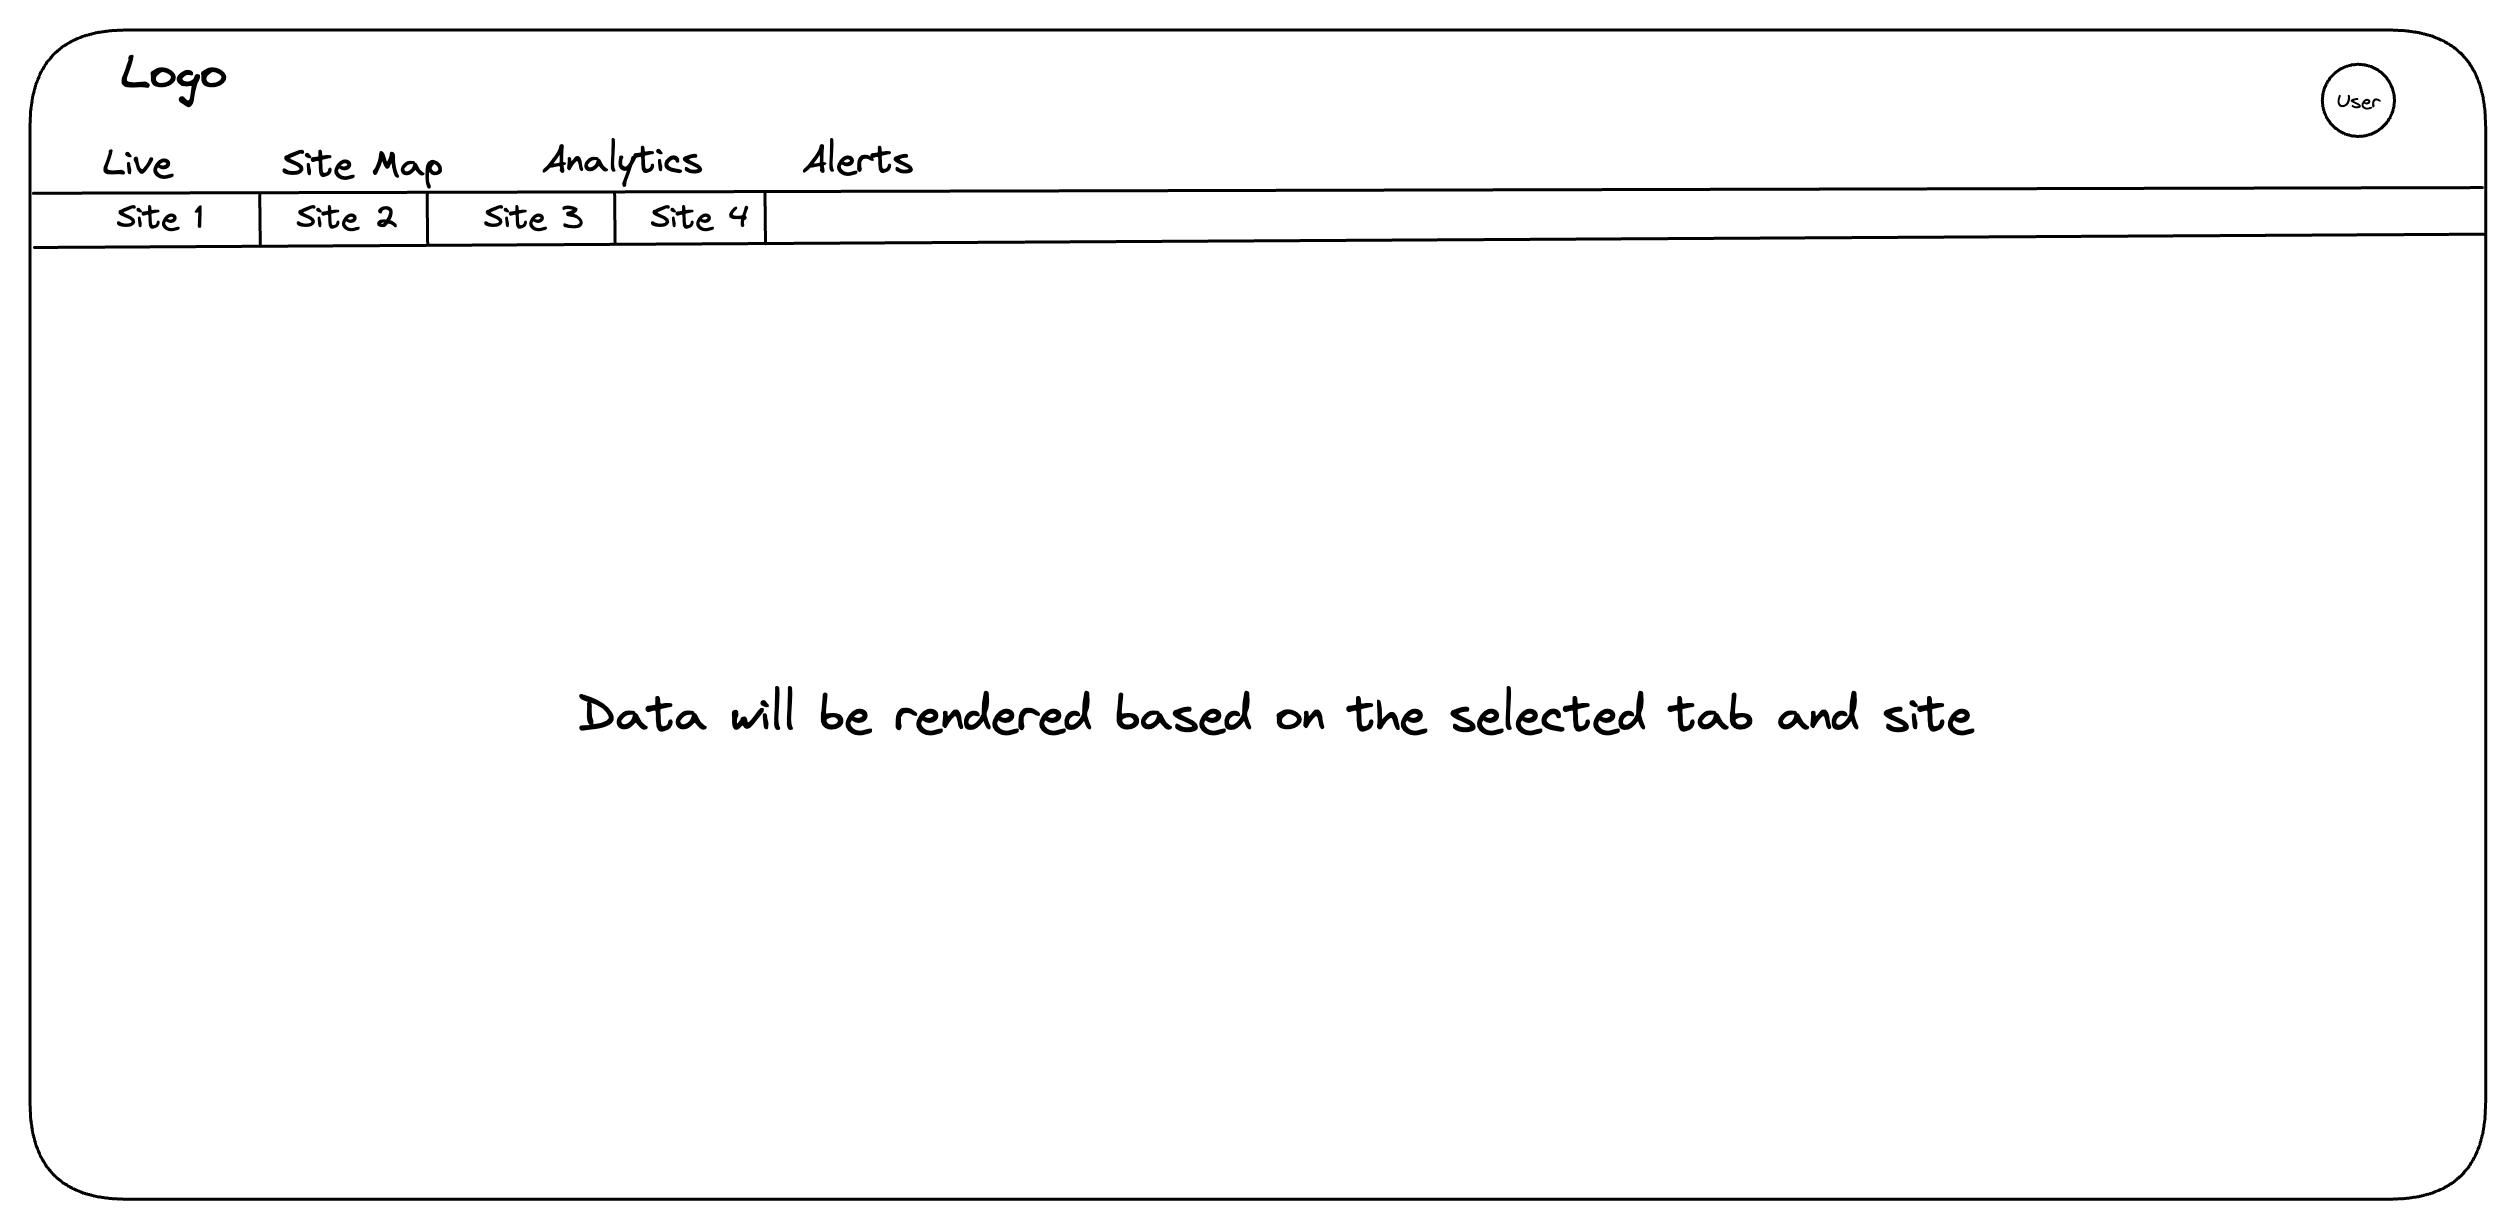
Key Requirement: Multi-Site Scalability Although Phase 1 uses only one physical site, the UI must be built dynamically to support N sites.
-
Logic: The dashboard layout is a Template. It should not hardcode "Home Lab".
-
Trigger: A "Site Selector" (Tabs/Dropdown) controls which data stream is currently rendering.
-
Payload: The WebSocket stream will contain a device_id. The UI must filter/route messages based on the selected site.
Data Contracts
To ensure the UI works with the backend when it is ready, please use these exact TypeScript definitions for your components.
Telemetry Packet (Live Stream)
This is the data you will receive each second through WebSocket.
// source: communication-interface.md

export interface SystemStatus {
  state: "IDLE" | "CHARGING" | "DISCHARGING" | "FULL" | "EMPTY" | "ERROR";
  mode: "AUTO" | "MANUAL";
  error_flags: string[]; // e.g., ["OVERHEAT", "COMM_LOSS"]
  wifi_strength: number;
}

export interface BatteryData {
  voltage: number;          // V
  current: number;          // A (Positive = Charging)
  power: number;            // W
  soc: number;              // % (0-100)
  charge_power?: number;    // kW (when charging)
  discharge_power?: number; // kW (when discharging)
  temperature?: number;     // °C
  capacity?: number;        // kWh usable capacity
  soh?: number;             // % State of Health
}

export interface GridData {
  voltage: number;          // V
  current?: number;         // A (optional for single-phase)
  power: number;            // W (Negative = Exporting)
  frequency: number;        // Hz
  reactive_power?: number;  // kVAR
  apparent_power?: number;  // kVA
  power_factor?: number;    // 0-1 (cos φ)
  energy_import?: number;   // kWh cumulative
  energy_export?: number;   // kWh cumulative
  total_energy?: number;    // kWh
  demand?: number;          // kW instantaneous
  peak_demand?: number;     // kW
}

export interface InverterData {
  dc_voltage?: number;      // V
  dc_current?: number;      // A
  dc_power?: number;        // kW
  ac_voltage?: number;      // V
  ac_current?: number;      // A
  ac_power?: number;        // kW
  efficiency?: number;      // %
  energy_generated?: number;// kWh cumulative
  state?: string;           // "RUNNING" | "IDLE" | "FAULT" | "STANDBY"
  fault?: boolean;
}

export interface LoadData {
  active_power?: number;    // kW
  energy_consumed?: number; // kWh cumulative
  runtime_hours?: number;   // hrs
  demand?: number;          // kW
  peak_demand?: number;     // kW
  status?: "ON" | "OFF";
}

export interface EnergyMetrics {
  cost?: number;            // currency
  co2_kg?: number;          // kg CO2 emissions
}

export interface TelemetryPayload {
  device_id: string;        // Crucial for Multi-Site filtering
  timestamp: string;        // ISO 8601
  system_status: SystemStatus;
  battery: BatteryData;
  grid: GridData;
  inverter?: InverterData;  // Optional for systems with solar
  load?: LoadData;          // Optional load monitoring
  energy?: EnergyMetrics;   // Optional cost/emissions tracking
}
Site Configuration
Since the telemetry only sends IDs (e.g., ems_001), the Frontend needs a "Config Map" to make it human-readable.
export interface SiteConfig {
  id: string;           // Matches 'device_id' in payload
  name: string;         // Display Name (e.g., "Coimbatore Campus")
  capacity_kw: number;  // For calculating load percentages
  location: string;
}

// MOCK CONFIG FOR PHASE 1
export const SITES: SiteConfig[] = [
  { id: "ems_001", name: "Home Lab (Primary)", capacity_kw: 5, location: "Nilgiris" },
  { id: "ems_002", name: "Remote Site A", capacity_kw: 10, location: "Coimbatore" }, // Placeholder
];
Implementation Strategy
Step 1: Site Context Provider
We should not pass device_id as props through 10 layers of components.
-
Create a React Context
-
Store: selectedSiteId (default: ems_001)
-
Behavior: When the user clicks a Tab (Site 1/Site 2), the context should be updated based on that. All charts should automatically re-render with data for the new ID.
Step 2: Webhook Integration (Hook)
Create a hook useTelemetry(siteId) that manages the connection.
-
Logic:
-
Connect to wss://api.domain.com/ws/device/{siteId}
-
If siteId changes, close the old socket and open a new one.
-
Return the latestData object.
-
Step 3: Dynamic Rendering Rules
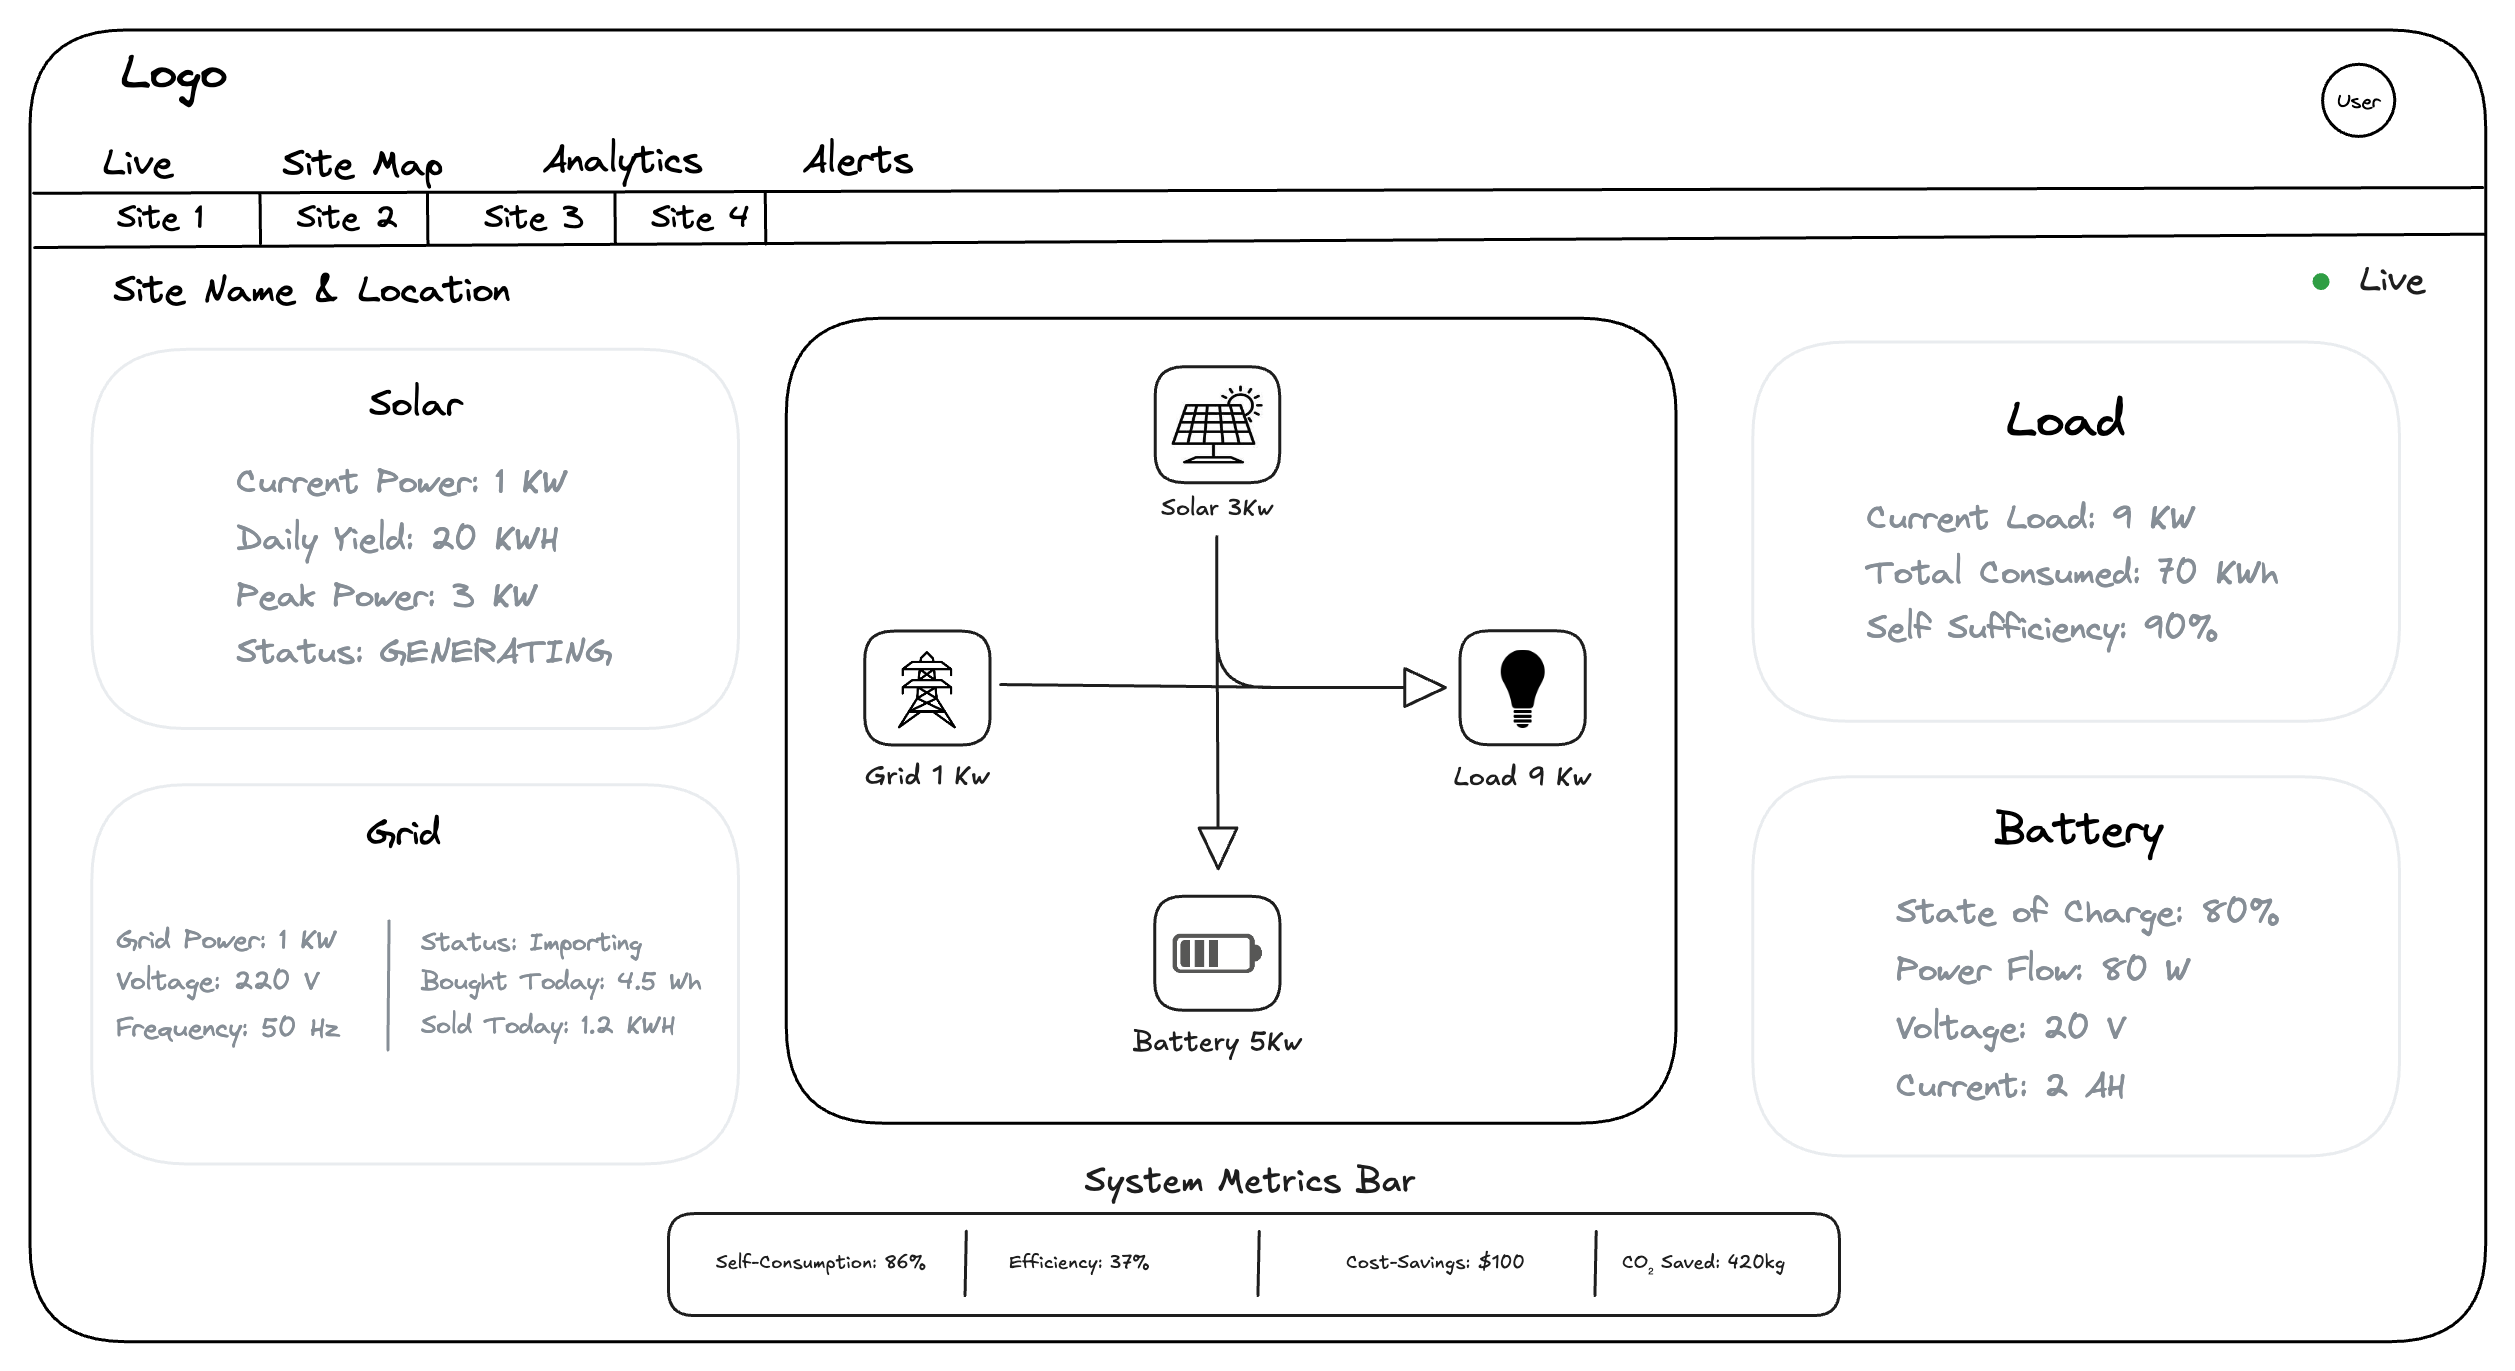
The dashboard must react visually to the system_status_state:
| State | Color Theme | UI Behavior |
|---|---|---|
| CHARGING | Green / Teal | Show arrow moving Grid → Battery |
| DISCHARGING | Blue / Cyan | Show arrow moving Battery → House |
| IDLE | Gray | Animations stopped |
| ERROR | Red / Pulse | Show a prominent alert banner with error_flags |
Tabs
Live Tab
Grid Metrics (Source-based Parameters)
| Parameter | Unit | Purpose | Source |
|---|---|---|---|
| Grid Power | W | The Net Meter value. • Positive (+): You are Paying (Importing) • Negative (−): You are Earning (Exporting) |
grid.power |
| Voltage | V | Critical for safety. If this drops < 200V or spikes > 250V, show a warning. | grid.voltage |
| Current | A | Phase current (optional for single-phase systems) | grid.current |
| Frequency | Hz | Grid health indicator (Standard: 50.0Hz or 60.0Hz). | grid.frequency |
| Reactive Power | kVAR | Non-working power component (power quality indicator) | grid.reactive_power |
| Apparent Power | kVA | Vector sum of active & reactive power | grid.apparent_power |
| Power Factor | – | Phase efficiency (cos φ). Values < 0.95 indicate poor power quality. | grid.power_factor |
Energy Metrics (Source-based Parameters)
| Parameter | Unit | Purpose | Source |
|---|---|---|---|
| Energy Import | kWh | Cumulative energy purchased from grid | grid.energy_import |
| Energy Export | kWh | Cumulative energy sold back to grid | grid.energy_export |
| Total Energy | kWh | Net energy (Import − Export) | grid.total_energy |
| Demand | kW | Instantaneous demand (used for billing/alerts) | grid.demand |
| Peak Demand | kW | Highest demand within billing cycle | grid.peak_demand |
| Cost | currency | Total cost based on tariff × imported energy | energy.cost |
| CO2 | kg | Carbon emissions estimate (emission_factor × imported_kWh) | energy.co2_kg |
Grid Derived Metrics (Frontend Logic)
| Parameter | Formula / Logic | UI Display |
|---|---|---|
| Flow Status | If grid.power < 0 → Exporting Else → Importing |
Show text "Selling to Grid" vs "Buying from Grid" |
| Total Imported | Sum of (Power × Time) only when Power > 0 |
"Bought Today: 4.5 kWh" |
| Total Exported | Sum of (abs(Power) × Time) only when Power < 0 |
"Sold Today: 1.2 kWh" |
| Net Energy | Total Imported − Total Exported |
"Net Usage: 3.3 kWh" |
| Daily Cost | Sum(imported_kWh × tariff(time)) |
"Cost Today: $1.23" |
| Daily CO2 | Sum(imported_kWh × emission_factor) |
"CO₂ Today: 2.1 kg" |
| Power Quality | If power_factor < 0.95 → Show warning |
"Power Quality: Good" or "Warning: Low PF" |
Load & Consumption Metrics
| Parameter | Unit | Purpose | Formula (Frontend Logic) / Source |
|---|---|---|---|
| Current Load | W | The Live number for the diagram. | Load = GridPower + Solar − BatteryPower |
| Total Consumed | kWh | The total energy used today. | Sum of (Load × Time) since midnight |
| Self-Sufficiency | % | A critical Green Score showing how much load is powered by Solar/Battery vs Grid. | (1 − Total Grid Import / Total Load) × 100 |
| Load Demand | kW | Measured load demand (if metered separately) | load.demand |
| Peak Load | kW | Peak load demand today | load.peak_demand |
| Runtime Hours | hrs | Operating hours for specific equipment | load.runtime_hours |
Battery Metrics (Source-based Parameters)
| Parameter | Unit | Purpose | Source |
|---|---|---|---|
| State of Charge (SOC) | % | The most important number. Visualized as a Fuel Gauge or Donut Chart. | battery.soc |
| State of Health (SOH) | % | Battery health indicator (degrades over time) | battery.soh |
| Power Flow | W | Live number. • Positive (+): Charging • Negative (−): Discharging |
battery.power |
| Charge Power | kW | Instantaneous charging power | battery.charge_power |
| Discharge Power | kW | Instantaneous discharging power | battery.discharge_power |
| Voltage | V | Health indicator. If this hits 54.0V (FULL) or 42.0V (EMPTY), the state machine cuts off. | battery.voltage |
| Current | A | Safety indicator. High current generates heat. | battery.current |
| Temperature | °C | Thermal monitoring. Alert if > 45°C | battery.temperature |
| Capacity | kWh | Usable battery capacity | battery.capacity |
Battery Derived Metrics & State
| Parameter | Formula / Logic | UI Display |
|---|---|---|
| Time to Empty | (Capacity_Wh × SOC%) / Current_Power |
“2h 15m remaining” (Only when Discharging) |
| Time to Full | (Capacity_Wh × (1 − SOC%)) / Current_Power |
“45m to full” (Only when Charging) |
| Cycle Status | system_status.state |
“Status: CHARGING” (Mapped directly) |
Inverter Metrics (Source-based Parameters)
Note: Only applicable for systems with Solar PV or other generation sources.
| Parameter | Unit | Purpose | Source |
|---|---|---|---|
| DC Voltage | V | Input voltage from solar panels | inverter.dc_voltage |
| DC Current | A | Input current from solar panels | inverter.dc_current |
| DC Power | kW | Input power from DC source | inverter.dc_power |
| AC Voltage | V | Output AC voltage to grid/load | inverter.ac_voltage |
| AC Current | A | Output AC current | inverter.ac_current |
| AC Power | kW | Output AC power (what goes to load/grid) | inverter.ac_power |
| Efficiency | % | Conversion efficiency (AC_Power / DC_Power × 100) | inverter.efficiency |
| Energy Generated | kWh | Cumulative energy generated | inverter.energy_generated |
| State | enum | Operational state (RUNNING / IDLE / FAULT / STANDBY) | inverter.state |
| Fault Status | bool | Fault indicator | inverter.fault |
Inverter Derived Metrics
| Parameter | Formula / Logic | UI Display |
|---|---|---|
| Daily Generation | Sum of (AC_Power × Time) since midnight |
"Generated Today: 12.5 kWh" |
| Conversion Loss | DC_Power − AC_Power |
"Loss: 0.3 kW" |
| Performance Ratio | Actual_Generation / Expected_Generation × 100 |
"Performance: 94%" |
| Status Indicator | Map state to color (Green=RUNNING, Red=FAULT) |
"Status: RUNNING" with color |
Site Map Tab
Layout Architecture
Structure
-
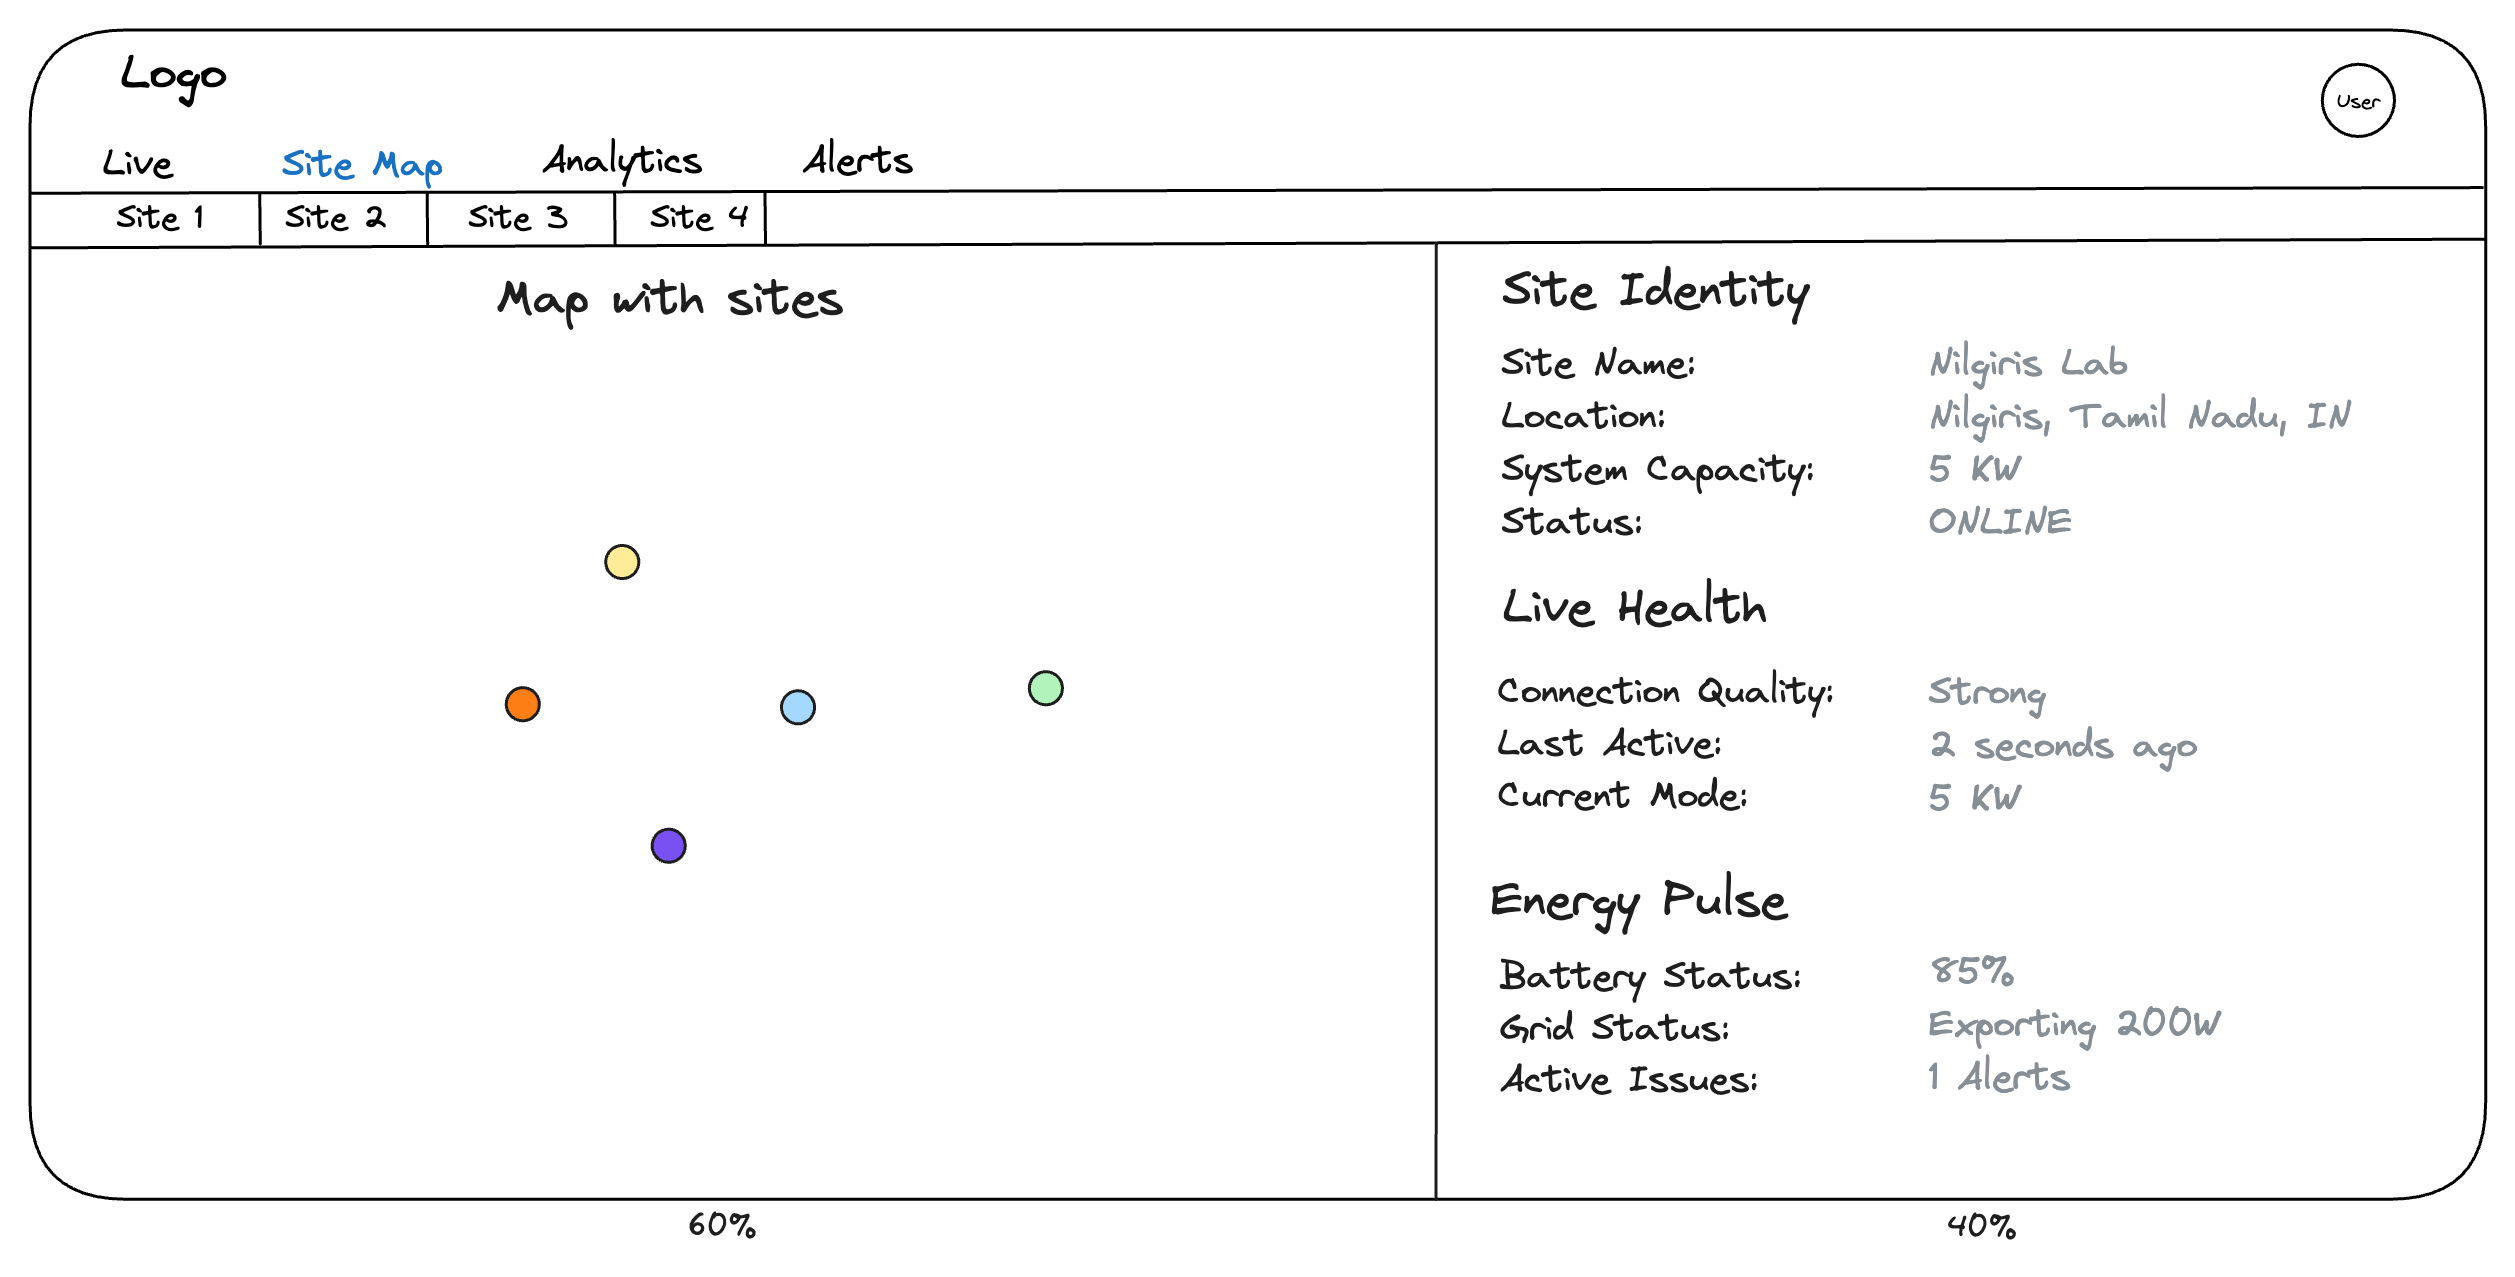
Container: Use a Flexbox container with a fixed height (e.g., calc(100vh - 64px))
-
Left Column (60%): The Map Canvas. It renders the geographical "Pins".
-
Right Column (40%): The information Panel. It renders the data for the currently selected pin.
The Interactive Map
To visualize fleet distribution and provide high-level status at a glance.
-
Data Source: SITE_MAP_DATA (Static Array)
-
Rendering Logic:
- Iterate through the SITE_MAP_ARRAY array.
- Place a marker at {lat, lng} for each site.
- Color Coding:
- Green: System is healthy (state != ERROR && timestamp < 60s)
- Red: System is in trouble (state == ERROR or error or error_flags > 0)
- Gray: System is offline (timestamp > 60s).
- Interaction: While clicking a site it should render the Details panel in the right side as shown in the above layout.
Details Panel
It shows the "Identity", "health", and "pulse" of the selected site as shown in the wireframe.
Site Identity (Static Data)
-
Data Source: SITE_MAP_DATA (Config file).
-
Fields: Site Name, Location, Capacity, Status.
The above fields are static data so they can remain unchanged.
Live Health (Telemetry)
-
Data Source: Websocket Stream (system_status object)
-
Fields: Connection Quality, Last Active and Mode should be updated from the websocket each second.
Energy Pulse (Telemetry)
-
Data Source: Websocket Stream (battery & grid object).
-
Fields: Battery Status, Grid Status, Active Issues.
These fields should be rendered from the Websocket that emits the battery data.
Note: We need to utilize a store management tool (like redux or zustand) to handle the data efficiently across component persistantly.