SiteMap Synchronization
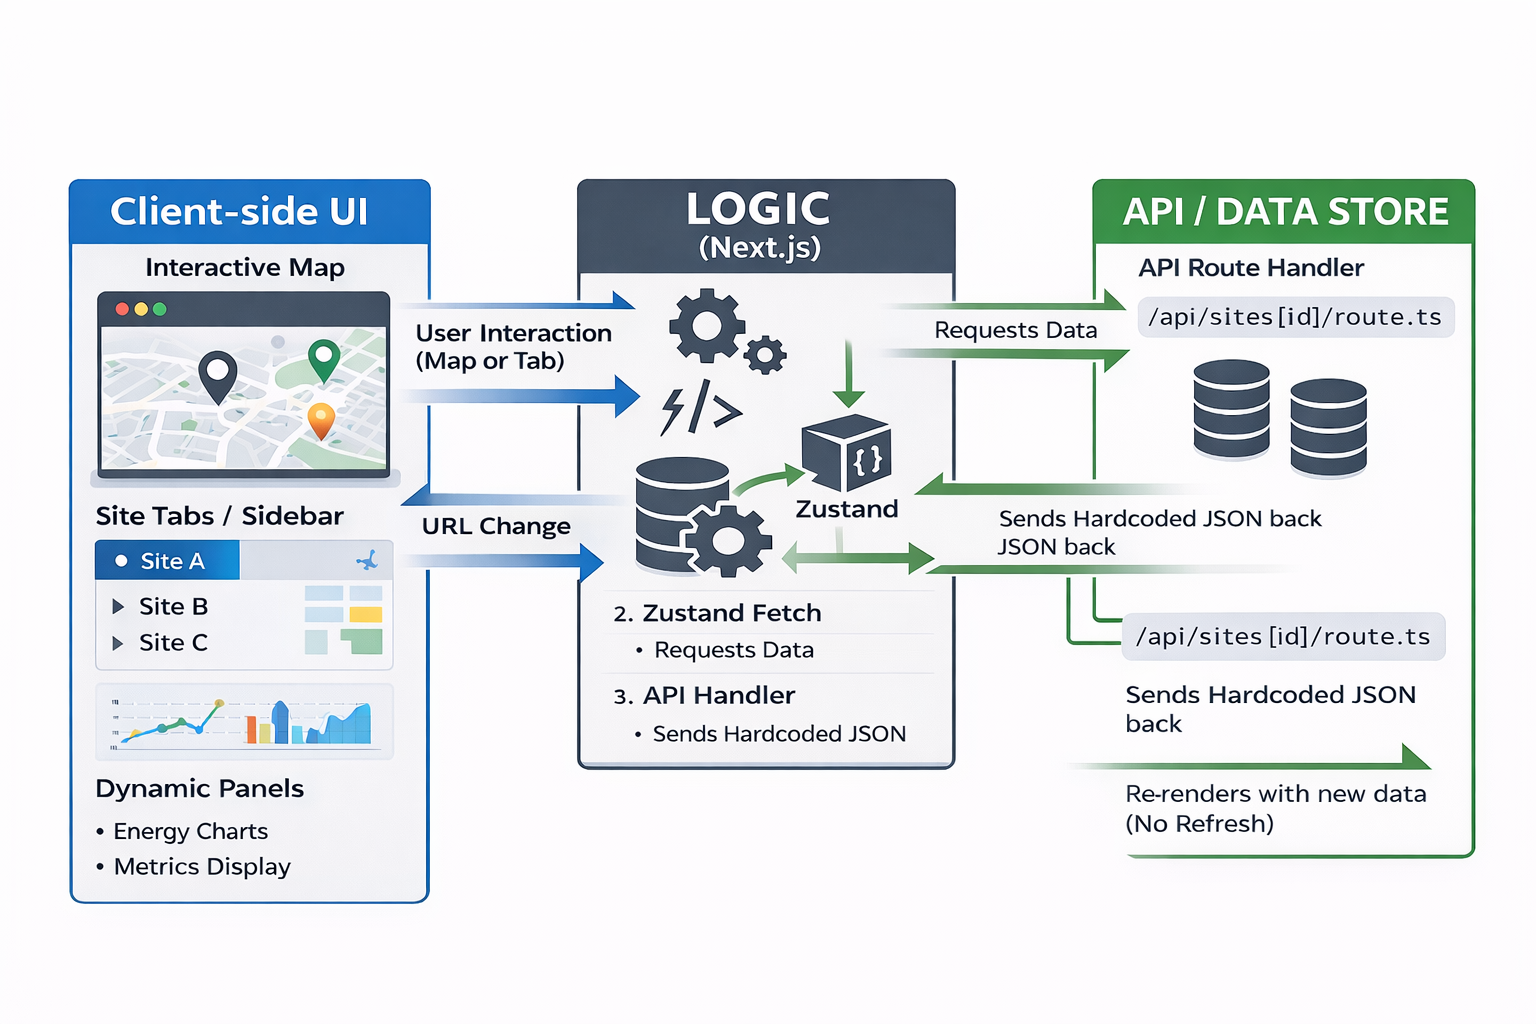 The goal of this system is to provide a synchronized experience between the Interactive Map and the Dashboard UI Panels. To avoid hard refreshes, we utilize Zustand as a central state store that coordinates data between the UI and the Map, triggered by Next.js Dynamic Routing.
System Architecture Logic
The architecture follows a "Triangular Sync" pattern:
- The URL: Acts as the primary trigger (/sites/[siteId]).
- Zustand Store: Acts as the data manager. It fetches data from the API and holds it in memory.
- The Components: The Map and UI "listen" to the Zustand store and update themselves automatically.
Requirement Fulfillment
Requirement 1: UI-to-Map (Tab/Sidebar Click)
-
Action: User clicks a "Site B" tab.
-
Process:
1. The URL changes to /sites/site-b.
2. A useEffect hook in the layout detects this change and calls the Zustand Action setActiveSite('site-b').
3. Zustand fetches the hardcoded data from /api/sites/site-b.
4. The Map is subscribed to Zustand; it sees the new coordinates and executes a smooth flyTo().
- Result: The map pans to the new site without a page reload.
Requirement 2: Map-to-UI (Marker Click)
- Action: User clicks a Site Marker on the map.
- Process:
- The Map triggers router.push('/sites/site-c').
- The URL updates, which triggers the Zustand store to refresh.
- The UI Panels (Energy Charts, Metrics) are subscribed to the Zustand store. They see the new data and re-render.
- Result: The charts and site details update instantly to reflect the site clicked on the map.
The "Just-in-Time" Data Flow (API Layer)
To keep the frontend clean, we use Next.js API Handlers. This allows us to "hardcode" the data in a way that mimics a real database.
- API Folder: app/api/sites/[siteId]/route.ts
- Logic: When Zustand requests data for an ID, the handler looks up the site in a local JSON object and returns it.
Technical Benefits of Zustand in EMS
| Feature | Benefit |
|---|---|
| No Hard Refresh | Maintains WebSocket/Real-time energy streams without interruption. |
| Shared State | The Map and UI always show the same site data because they read from the same store. |
| Performance | Only components using the specific "activeSite" data will re-render. |
| Future Proof | You can replace the hardcoded API with a live SQL database later without changing your Zustand logic. |
OpenStreetMap (OSM)
Overview
OpenStreetMap (OSM) is an open-source, community-driven geospatial database that provides detailed map data of real-world features. It is commonly used as a base mapping solution in applications that require geographic context, including Energy Management Systems (EMS).
OSM primarily focuses on representing where assets are located and what they represent, rather than how they are visually displayed or interacted with.
What OpenStreetMap Provides
1. Geospatial Data Components (The "Physical Layer")
OSM data is structured using a tagging system that identifies specific infrastructure critical to energy management:
- Generation: power=plant and power=generator identify production sites (Solar, Wind, Nuclear, etc.) including their output capacity.
- Transmission & Distribution: power=substation, power=line, and power=cable define the grid’s topology and voltage levels.
- Storage (BESS): plant:source=battery identifies Battery Energy Storage Systems.
- Control Infrastructure: industrial=control_centre tags the physical locations of grid management facilities.
2. Native Interaction & Querying
- The Slippy Map: A pan-and-zoom interface available via standard tile servers.
- Data Inspection: The Query Features tool allows technical users to inspect raw metadata (e.g., voltage, operator, and frequency) directly from map nodes.
- Overpass API: A powerful query language used to extract specific EMS data subsets (e.g., "Pull all 110kV substations within a 50km radius") for external analysis or display.
Extending OpenStreetMap for EMS Features Using Mapping Libraries
OpenStreetMap (OSM) provides the geographic foundation for mapping energy infrastructure but does not include visualization or interaction features. These capabilities are added using external mapping libraries.
1. Leaflet.js (Industry Standard for Dashboards)
Leaflet is the most popular open-source mapping library. It is preferred for its "plugin-first" architecture and ease of implementation.
Best For: Lightweight web-based EMS monitors and mobile-ready utility maps.
EMS Functionality:
- Custom Markers: Easily replaces standard pins with industrial SVGs (e.g., wind turbines, battery symbols).
- Interactive Overlays: Uses
.bindTooltip()for the hover effects you requested and.bindPopup()for detailed asset information upon clicking. - Performance: Optimized for "human-scale" maps (e.g., mapping a city's microgrid).
2. MapLibre GL JS (High-Performance Vector Graphics)
MapLibre uses WebGL technology to render maps using the computer’s graphics card (GPU).
Best For: Complex smart grids or national-scale infrastructure with thousands of data points.
EMS Functionality:
- Massive Data Handling: Can render 50,000+ nodes (like every household smart meter in a region) without lag.
- Smooth Hover States: Allows for high-speed "per-feature" hover effects where power lines or zones highlight instantly as the mouse moves.
- 3D Extrusions: Can show buildings or battery containers in 3D to visualize facility volume or urban density.
3. OpenLayers (Scientific & Engineering Grade)
OpenLayers is a heavy-duty library built for high-accuracy GIS (Geographic Information Systems).
Best For: Engineering teams requiring advanced spatial calculations and support for legacy industrial map formats.
EMS Functionality:
- Projection Support: Essential for engineering tasks where distance and area measurements must be mathematically exact.
- Multi-Layer Management: Handles complex "sandwich" layers of data (e.g., satellite imagery + thermal heat maps + electrical circuit overlays).