Sweden
Loading...
India
Loading...
Energy Management System Dashboard - Feature List
1. Real-Time Monitoring Dashboard
1.1 Live Energy Flow Visualization
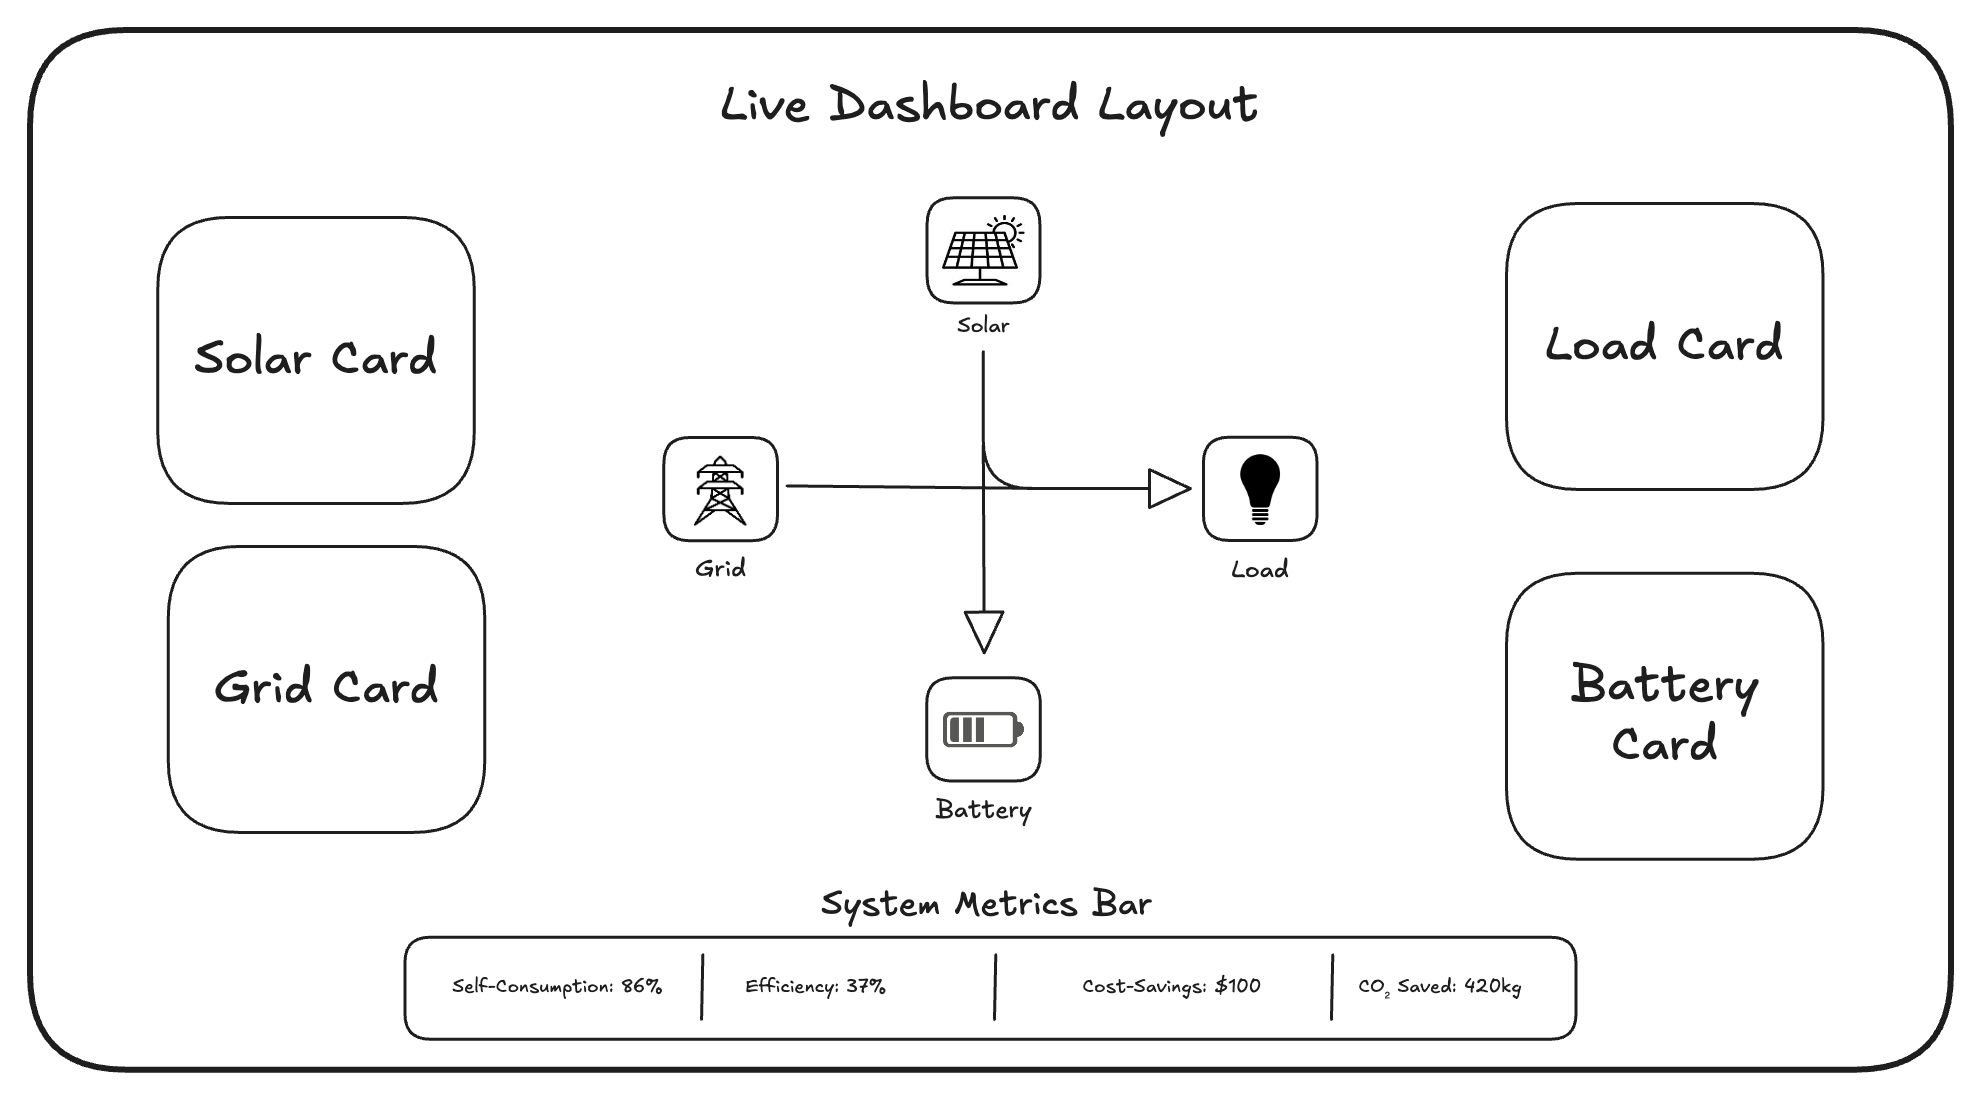
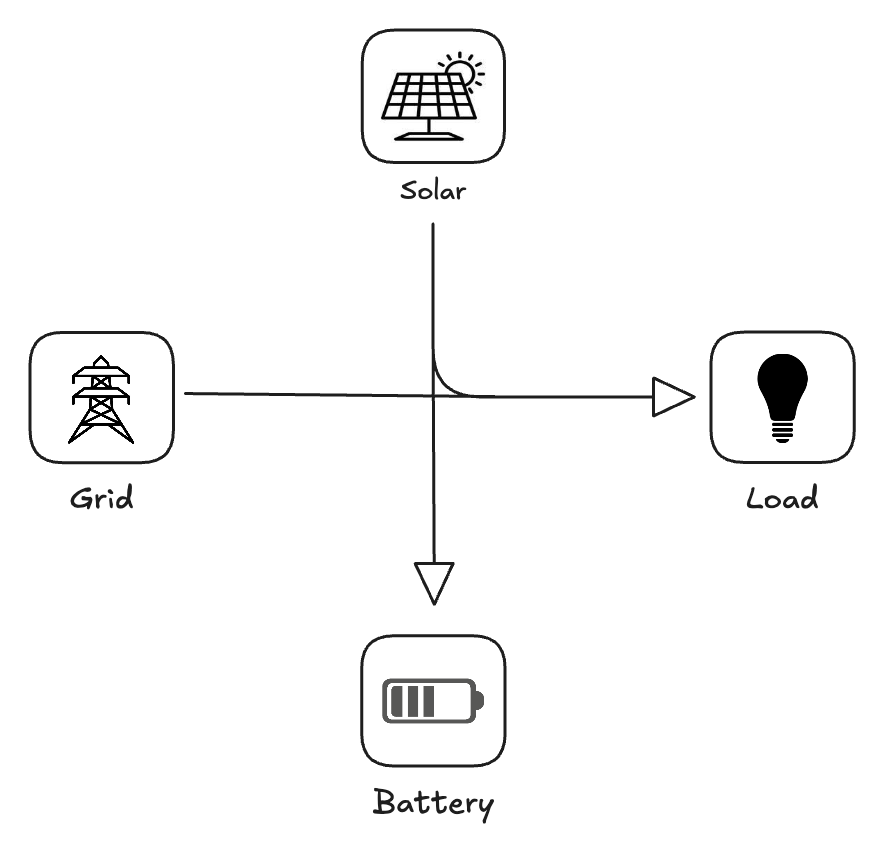
- Interactive Sankey diagram showing energy flows between:
- Solar -> Load / Battery / Grid
- Battery -> Load / Grid
- Grid -> Load / Battery
- Real-time power values (kW) on each flow path
- Directional arrows with animated flow intensity
Example Design Reference
Note: The above mentioned image, is soley for reference the actual UI will be developed seperately.
Description:
Flow Direction:
- Solar -> Load: When solar generation > 0 and building is consuming
- Solar -> Battery: When solar generation > load demand
- Solar -> Grid: When solar > (load + battery charging capacity)
- Battery -> Load: When battery discharging to meet load
- Battery -> Grid: When battery exporting to grid for revenue
- Grid -> Load: When grid supplying power to building
- Grid -> Battery: When grid charging battery
Flow thickness calculation
Thickness = (Power in kW / Max System Capacity) * Max Line Width
Animation Logic
- Flow Speed: Proportional to power (faster = more power)
- Direction = arrow direction on line
- Particle density = power density (more particles = more power)
Note: The UI designed should be mobile responsive so use flex boxes and make sure they render properly across multiple screens.
1.2 Multi-Site Overview (Multiple Locations)
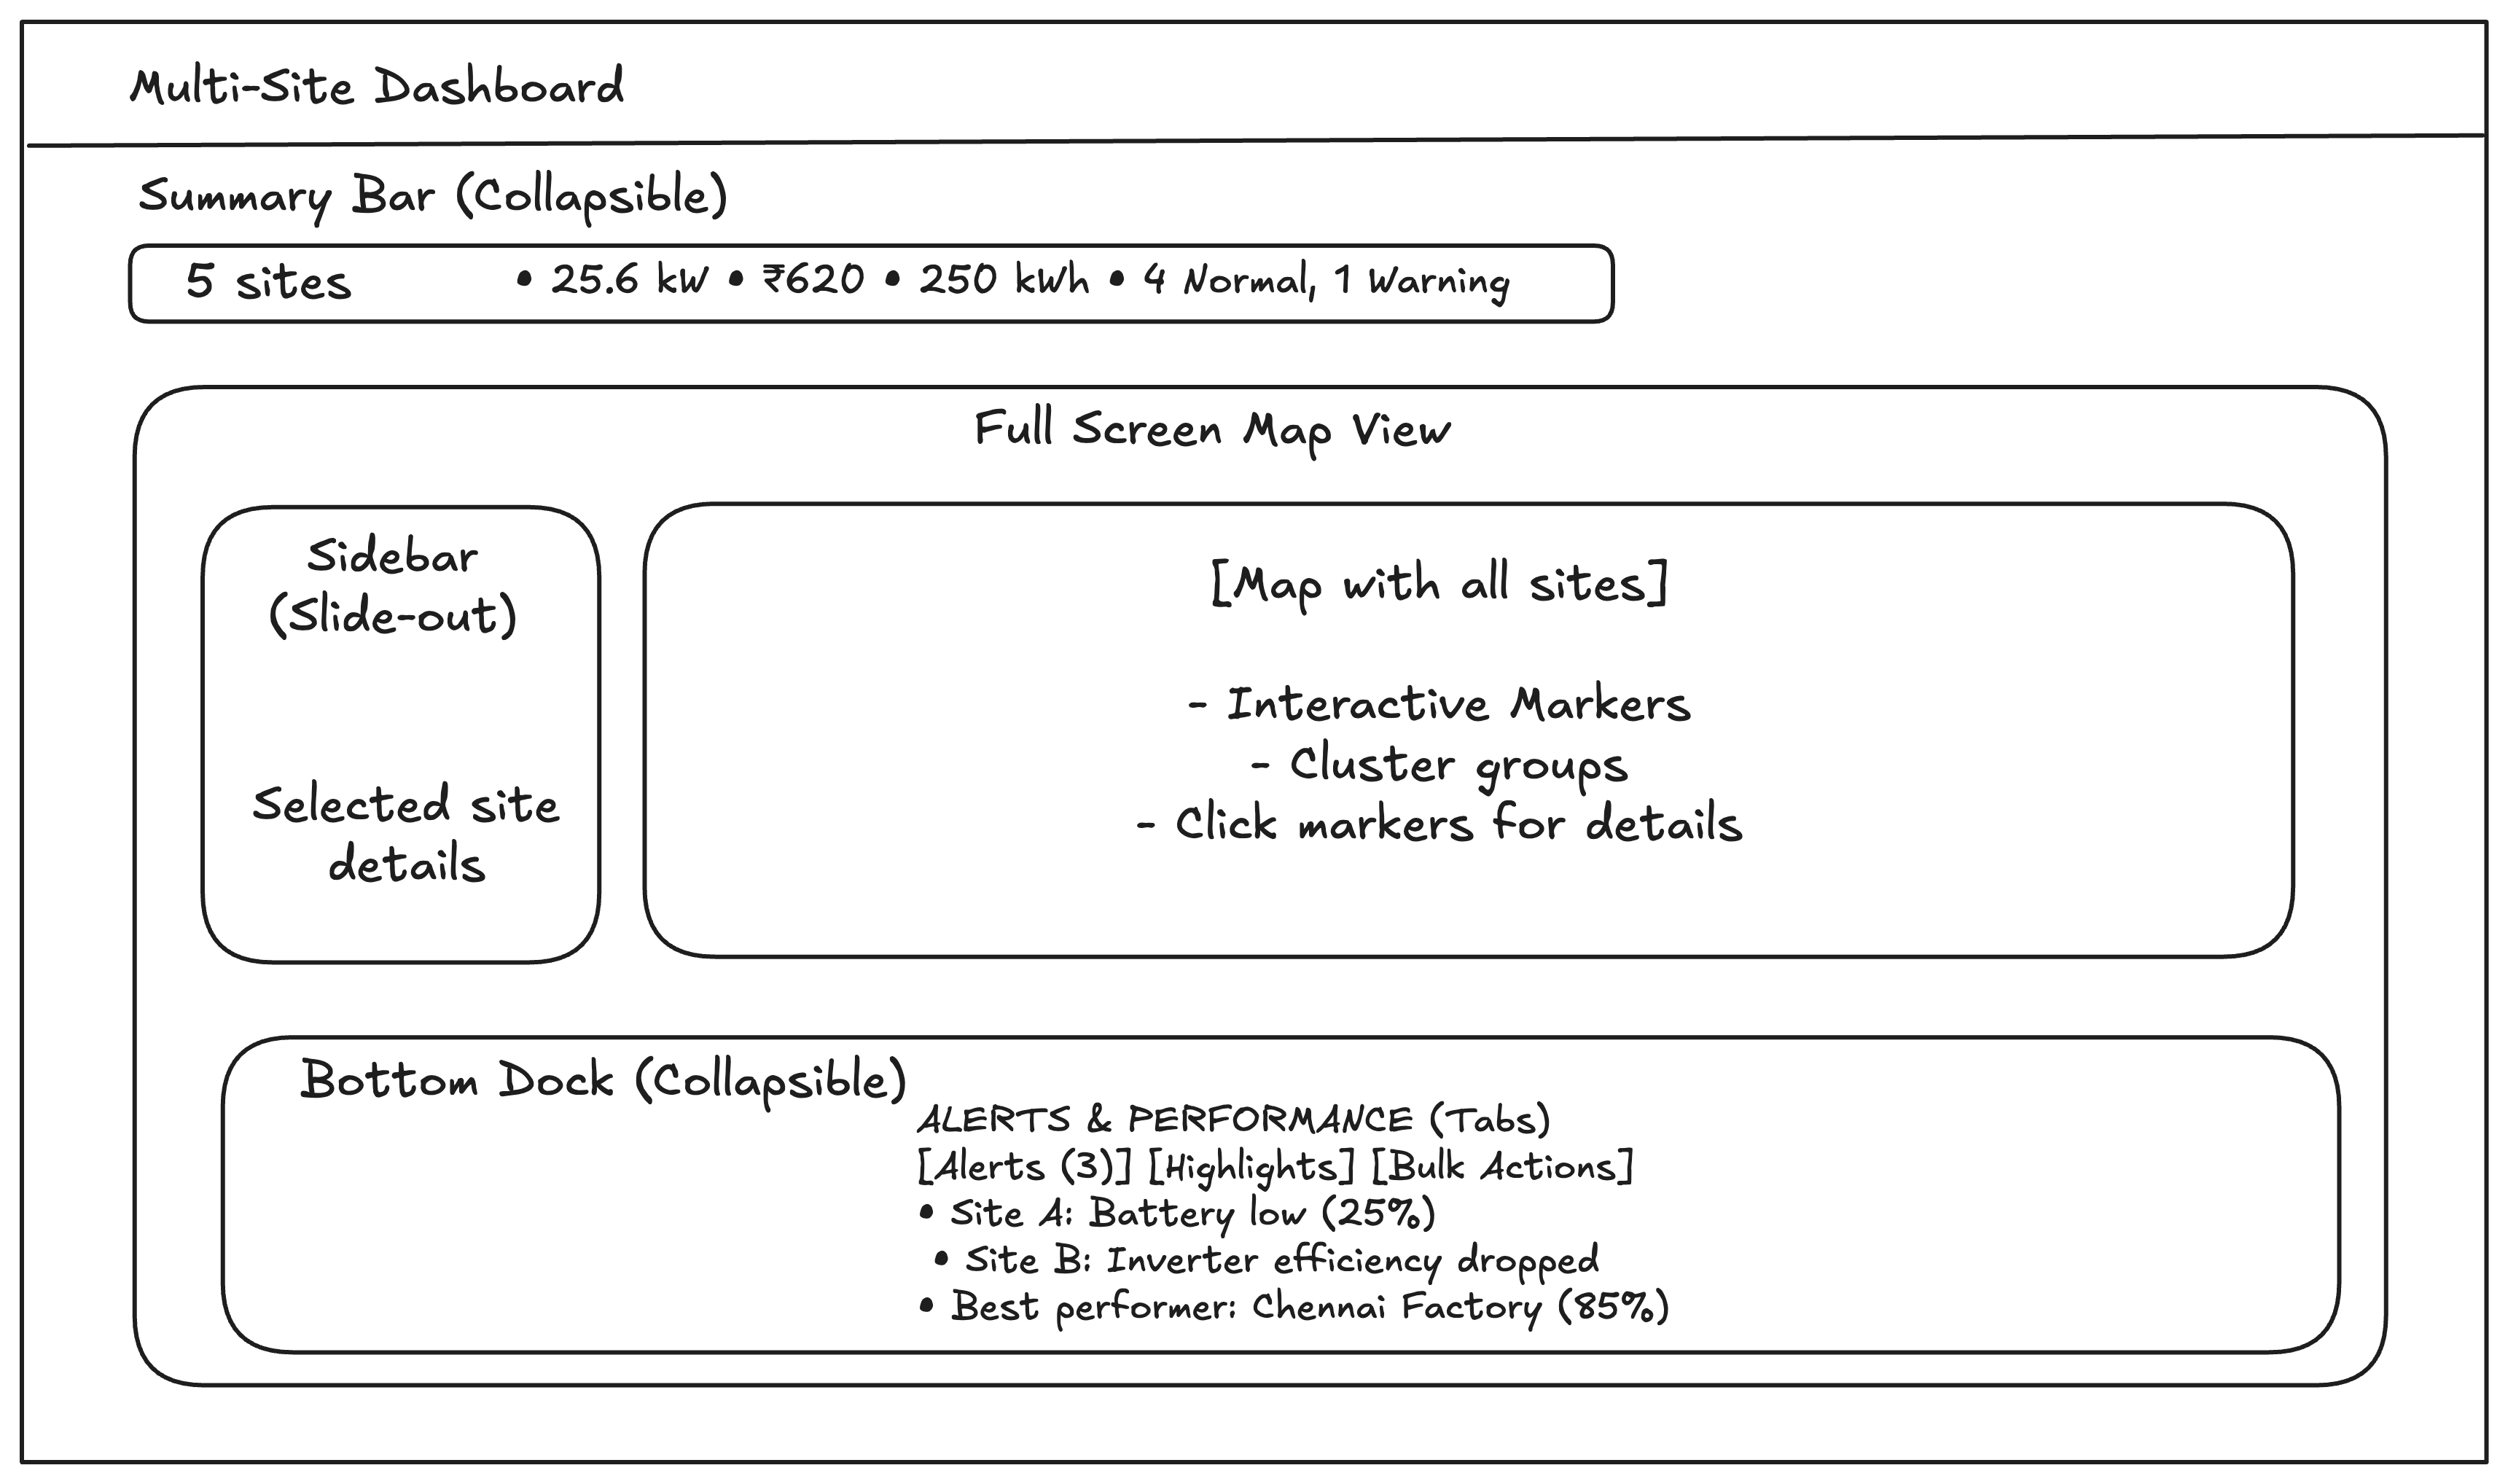
Note: This is for a representation of the below description, the actual UI maybe designed similarly but not exactly.
Map View
- Interactive map showing all our Solar+BESS locations
- Color-coded markers for each site
- Click any marker -> zooms in and shows site details
- Cluster display when multiple sites are close together
Site status indicators
- Green = Normal operation
- Yellow = Warning (e.g., low battery, underperformance)
- Red = Fault (equipment failure, communication lost)
- Gray = Offline/maintenance
Quick-View Site Cards
Each site has a clickable card showing:
- Site Name
- Status: 🟢 Normal
- Last Updated: 2 min ago
Key Metrics Grid:
Bottom Section:
- Today's savings
- Self-consumption
- Quick actions: "View Details" | "Control" | "Reports"
Bulk Operations
- Select multiple sites -> apply same command
- Compare sites -> side-by-side charts
- Group sites -> by region, type, or owner
Summary Bar
The summary bar should include these parameters:
- Total Portfolio: 5 Sites
- Total Generation: 25.6 kW
- Total Savings Today: ₹620
- Total Battery Capacity: 250 kWh
- Overall Status: 4 Normal, 1 Warning
Alert Summary Panel
Active Alerts (3):
- Site A: Battery low (25%)
- Site B: Inverter efficiency dropped
- Site C: Communication lost (investigating)
Perfomance Highlights:
- Best performer: Chennai Factory (85% self-consumption)
- Needs attention: Mumbai Office (40% battery health)
- Most Savings: Bangalore Plant ($200 today)
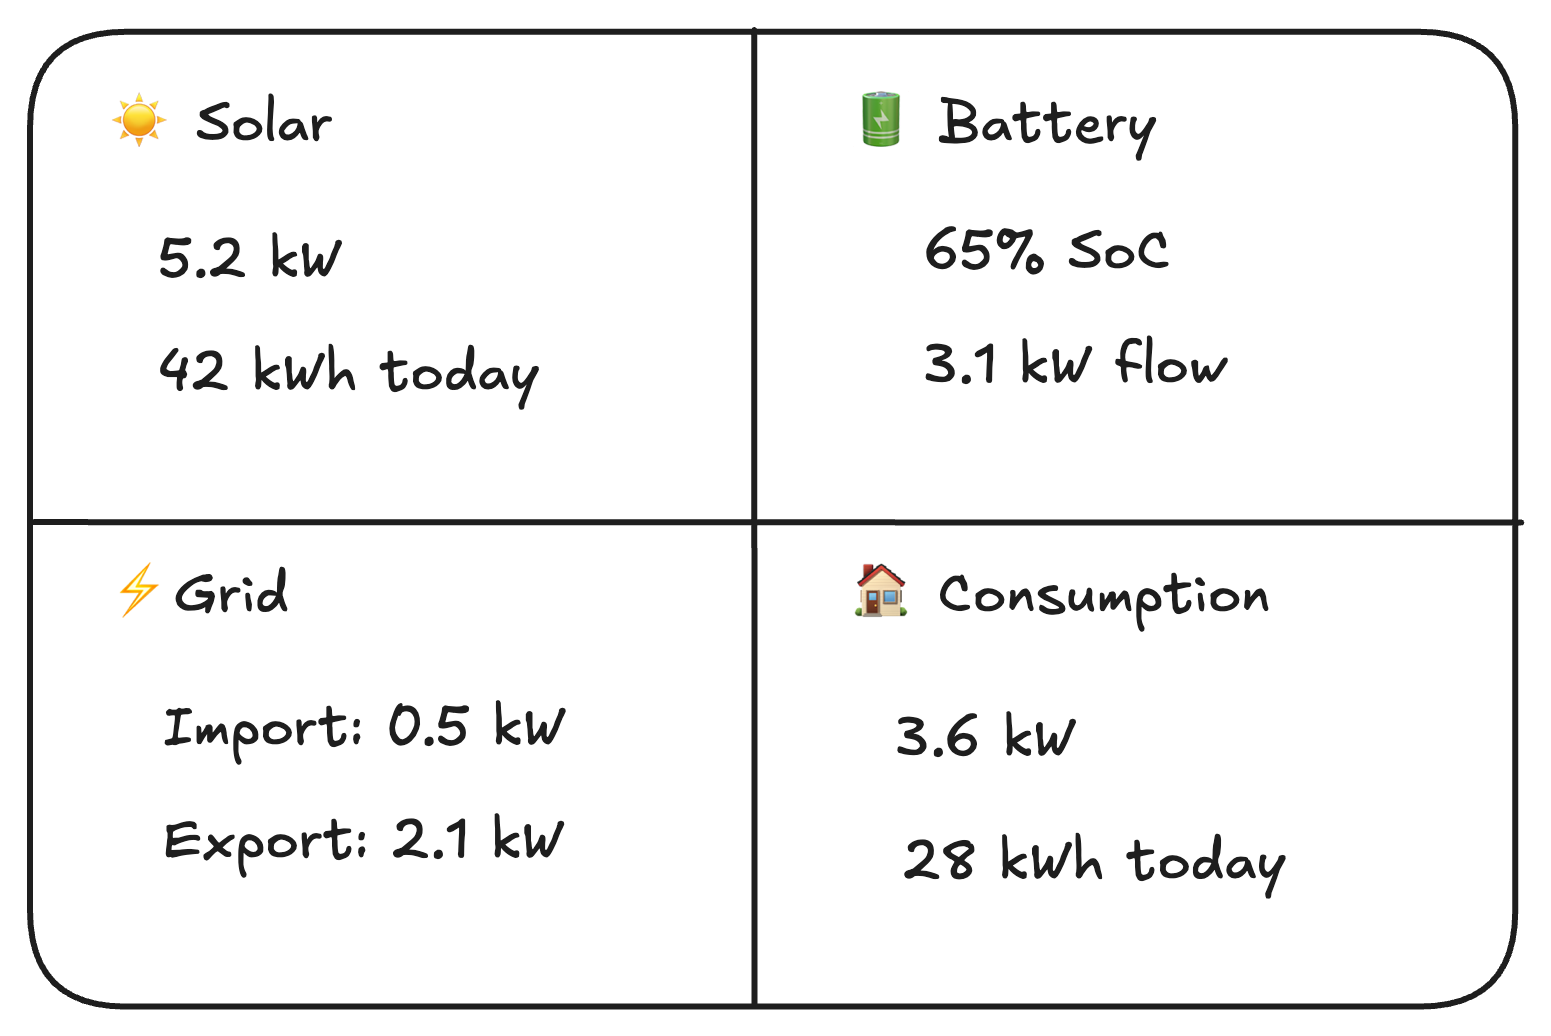
1.3 Instantaneous Metrics Display
- Solar Generation (kW, kWh today)
- Battery Status (SoC %, power kW, temperature)
- Grid Interaction (Import/Export kW, net balance)
- Load Consumption (total kW)
- Self-consumption rate (% of solar used on-site)
- System efficiency metrics
2. Control & Operation Features
Manual Control Panel
- Direct battery control buttons:
- Charge (from solar/grid)
- Discharge (to load/grid)
- Idle/stop
- Power slider for charge/discharge rate (kW)
- Duration/timer settings
- Emergency stop button
Operation Mode Selector
- Automatic Mode: Full optimization based on forecasts/prices
- Semi-Automatic: Suggests actions, requires confirmation
- Manual Mode: Full user control
- Priority Settings:
- Maximize self-consumption
- Maximize revenue
- Minimize cost
- Battery preservation
- Grid support
Scheduling Interface
- Calender view for setting schedules
- Time-based rules (e.g., "Charge from grid 2 AM - 5 AM")
- Event-based rules (e.g., "Discharge if grid price > $10/kWh")
- Copy/paste schedule patterns
- Override capabilities for special days
3. Intelligent recommendation engine
Smart suggestion panel
- "Best time to charge/discharge" notifications
- Price alert notifications (grid price spikes/drops)
- Maintenance suggestions
- Efficiency improvement tips
Optimization Recommendations
- Daily/weekly schedule suggestions
- Battery cycle optimization
- Cost-saving opportunities
- Revenue generation ideas (grid services)
Analysis tool
- Simulate different strategies
- Compare cost/revenue outcomes
- Battery degradation impact estimation
- ROI calculations for additional equipment
4. Analytics & Reporting
Real-Time charts
- Power flow timeline (15-minute intervals)
- Battery SoC history
- Load profile visualization
- Generation vs consumption comparison
- Cost accumulation chart
Historical Analysis
- Daily, weekly, monthly, yearly views
- Performance ratios (actual vs expected generation)
- Battery health trends (capacity fade, efficiency)
- Cost savings reports
- Carbon emission reductions
Custom Report Generator
- Select data ranges
- Choose metrics to include
- Export formats: PDF, Excel, CSV
- Scheduled automated reports (email delivery)
5. Alert & Notification System
Real-time Alerts
- Battery SoC high/low thresholds
- Equipment faults or warnings
- Grid price threshold breaches
- Weather alerts affecting generation
- Communication failures
Notification Channels
- In-app notification center
- Email alerts
- SMS notifications
- Mobile push notifications
- Webhook integration (Slack, Teams, etc...)
Alert Management
- Acknowledge/resolve workflow
- Escalation rules
- Historical alert log
- Mute/disable specific alerts
6. System Configuration
Device Management
- Add/remove/edit devices (inverters, BMS, meters)
- Protocol configuration (Modbus, CAN, MQTT settings)
- Communication testing tools
- Device health monitoring
Tariff & Price Management
- Multiple tariff structures (ToU, flat, dynamic)
- Grid export pricing settings
- Demand charge parameters
- Tax and fee configurations
User & Access Management
- Multi-user support with roles:
- Administrator (full access)
- Operator (control + monitoring)
- Viewer (read-only)
7. Grid Interaction Features
Grid Services Dashboard
- Frequency response capability
- Voltage support settings
- Export power limiting
- Grid code compliance monitoring
Market Participation
- Real-time price display
- Bid management Interface
- Revenue Tracking from grid services
- Contract Management
Islanding & Backup Power
- Grid outage detection
- Automatic Islanding transition
- Critical load management
- Backup power duration estimation
8. Integration Capabilities
External Data Sources
- Weather API Integration
- Electricity market data feeds
- Utility data import
Third-Party Integration
- SCADA Systems
- ERP/account software
- IoT platform connectivity
Open API
- REST API for external access
- Webhook support
- Data export endpoints
- Custom Integration hooks
9. Advanced visualization
Forecasting views
- Solar generation forecast chart
- Load prediction visualization
- Price forecast timeline
- Battery schedule preview
Perfomance Dashboards
- Key Performance Indicators (KPIs)
- Efficiency gauges
- Comparative benchmarks
- Goal tracking progress
3D/Interactive Visualization
- Virtual power plant view
- Equipment status visualization
- Energy flow animations
- Geographic heat maps
10. Security & Reliability
Security Features
- Multi-factor authentication
- IP whitelisting
- Encrypted communications (TLS)
- Regular security audits
System Reliability
- Redundant data collection
- Local storage for offline operation
- Automatic failover
- Backup/restore capabilities
11. User Experience Essentials
Dashboard Customization
- Widget-based layout
- Drap-and-drop rearrangement
- Show/hide panels
- User-specific dashboard views
12. Diagnostics & Maintenance
System Health Monitor
- Communication status Indicators
- Data quality metrics
- System performace monitoring
- Log viewer and analyzer
Maintenance Features
- Predictive maintenance alerts
- Service schedule tracking
- Technician dispatch integration